
Rethinking Your Machine Learning Results Tracking
I find that a surprising number of people in the machine learning field do not track their metrics in a structured and automated way. Some only keep track of what their current single best model is, some put their faith in storing their whole experiment history in TensorBoard graphs, and some manually log their metrics in a Google Spreadsheet. While these methods might be sufficient in some cases, I find that they can be significantly improved in terms of the amount of insight they provide and resources they consume. In this post I will be talking about how to do this, and will go into depth about the why, what and how of tracking machine learning project metrics in a structured manner over time. I’ll be basing this on numerous projects I’ve been involved in, and also the many mistakes I’ve made in them. With metrics, I mean the final metrics you generate from an experiment, rather than the metrics you get per epoch during training.
Why track your metrics?
There are many reasons why you should track your metrics over time in a structured way. A few of these are:
- Structured metrics provide a clear picture of whether or not your project is progressing, and helps to ensure that all those hours spent tweaking architectures and collecting data are actually paying off. It also facilitates an understanding of what leads to progress, which will help you avoid dead ends in later projects.
- Visualizing progress is also motivating for your team. Machine learning can be very unforgiving, and sometimes it feels like you’ve tried a hundred ideas and none of them have worked. Nothing is as demoralizing as the feeling of stagnation, so the ability to see that your models are actually a lot better than a year ago is a huge morale booster.
- Structured metrics can reassure managers that you’re on target. Building good enough machine learning models often takes a lot of time and resources. Your managers are unlikely to be satisfied if your weekly status report only consisted of qualitative examples. What matters to them is that you’re improving on the metrics that are tied to your specific business problem. If you are able to concretely show a slow but steady improvement in your metrics, managers are far more likely to be assured about the direction of your project.
What to track?
The first thing you need to decide is what metrics to track. In machine learning, there’s often a hierarchy of metrics:
- At the first level, we have metrics that are closely tied to the business problem, e.g. “How many monthly active users are there for our automatic segmentation tool?”. This metric is the thing that should drive your development, and should be determined together with someone that has a good understanding of your business problem.
- One level below that, we have metrics that more closely tie in with the technology. In this case, we could hypothesize that the better our segmentation model, the more likely people will use it. Let’s say that pixel-wise accuracy is a good way of measuring this. Accuracy, however, is not a continuous function of our model parameters, which makes it impossible to directly optimize with gradient based methods (what we use for training neural networks). Sometimes we have a continuous metric here, and then we can use this for optimization, e.g. MSE, MAE.
- If we have a non-continuous metric at the second level, we need to find a continuous proxy for it, one that can be directly optimized. For accuracy in particular, categorical cross-entropy is used.
From the perspective of a machine learning project lead, I would argue that the second level of metrics is the most useful for your day-to-day decision making, as it’s both interpretable and tightly connected to the model performance. Some examples of commonly used metrics here are accuracy and F1-score for classification problems, and mean squared error (MSE) and mean absolute percentage error (MAE) for regression problems.
The second thing you need to decide is how to visualize your selected metrics. I personally like to plot the aggregated maximum over time (Fig. 1), use barplots or lineplots for all metrics per experiment (Fig. 2), and use bias/variance decompositions for each experiment (Fig. 3), the last two sorted by performance.
 Fig. 1: F1-score over time.
 Fig. 2: Validation set accuracy per experiment, sorted by descending accuracy.
 Fig. 3: Bias/variance decomposition per experiment, sorted by descending validation set accuracy.
If applicable, we should track our selected metric(s) on our train-, dev/validation- and test sets. As usual, we should use our dev set to guide our modeling choices and what to deploy, and our test set to get an estimate of how our model generalizes to the real world. Andrew Ng writes extensively about this in his excellent book Machine Learning Yearning.
The type of metrics one needs to track is dependent on the technical problem and the business problem at hand. It’s not always initially obvious what will serve as a good metric, so one shouldn’t be afraid of changing it if the current one doesn’t feel suitable.
When I previously worked on a project in sales predictions, we initially used MSE as the main metric. We quickly noticed that something was missing; we were predicting sales for many different vendors with very different sales averages. This led to that an MSE, which was good for a vendor with high sales, was bad for one with low sales, making the numbers difficult to analyze. Also, when looking at an MSE value, we’d wonder whether we would do a better job just predicting the value from one day, one week, or one month before. These two reasons led us to switch to using the weekly mean absolute scaled error, which shows how much better off the model is compared to just predicting the same sales as the one occurring one week prior.
In addition to storing metrics, I also recommend storing the actual output from your models, enabling you to do qualitative evaluation. When tackling a new problem, you usually don’t know whether a given MSE is good enough for your business case. Take the segmentation example below, where the pixel-wise accuracy is 99.6%. This number sounds really high, but from a qualitative inspection we can see that the model is missing parts of the woman’s head, and might not be ready to put into production.

 Fig. 4: Input and output of an automatic segmentation model. Note the misprediction above the woman’s ear.
In another example, when I previously worked on a weather forecasting problem, we started an extensive hyperparameter tuning, and were happy when we saw the validation set MSE improving. However, when doing a qualitative inspection of the final best model, we saw that it was basically outputting a slightly perturbed mean value.
Storing the output of your model is highly useful not only for qualitative inspection, but also for demoing purposes.
I recommend storing as many hyperparameters as possible, as they help you reason about your results. Storing hyperparameters also forces you to parameterize you code, which in turn makes it easy to perform automated hyperparameter tuning.
Finally, store the commits and versions of the code that was run, to facilitate reproducibility and debugging. A proper dive into reproducibility is a whole other can of worms, and is beyond the scope of this post.
How to track and visualize
Among those who do track their metrics, it’s not uncommon to see it done through TensorBoard. TensorBoard is great for monitoring training progression and doing comparisons between a small number of different runs. However, when analyzing a larger number of experiments, it becomes very clunky, and it becomes very difficult for anyone except the experimenter to understand what’s going on.
Below we see TensorBoard after running a hundred experiments. Due to the cluttered visualization, it requires extra work to answer basic questions about your experiments such as which your best run is.
 Fig. 5: Visualizing the validation accuracies from one hundred MNIST experiments in Tensorflow.
Compare this to the simple Kibana visualization below, where the same runs are ordered by their maximum validation set accuracy, making it trivial to find the answer to the question above.
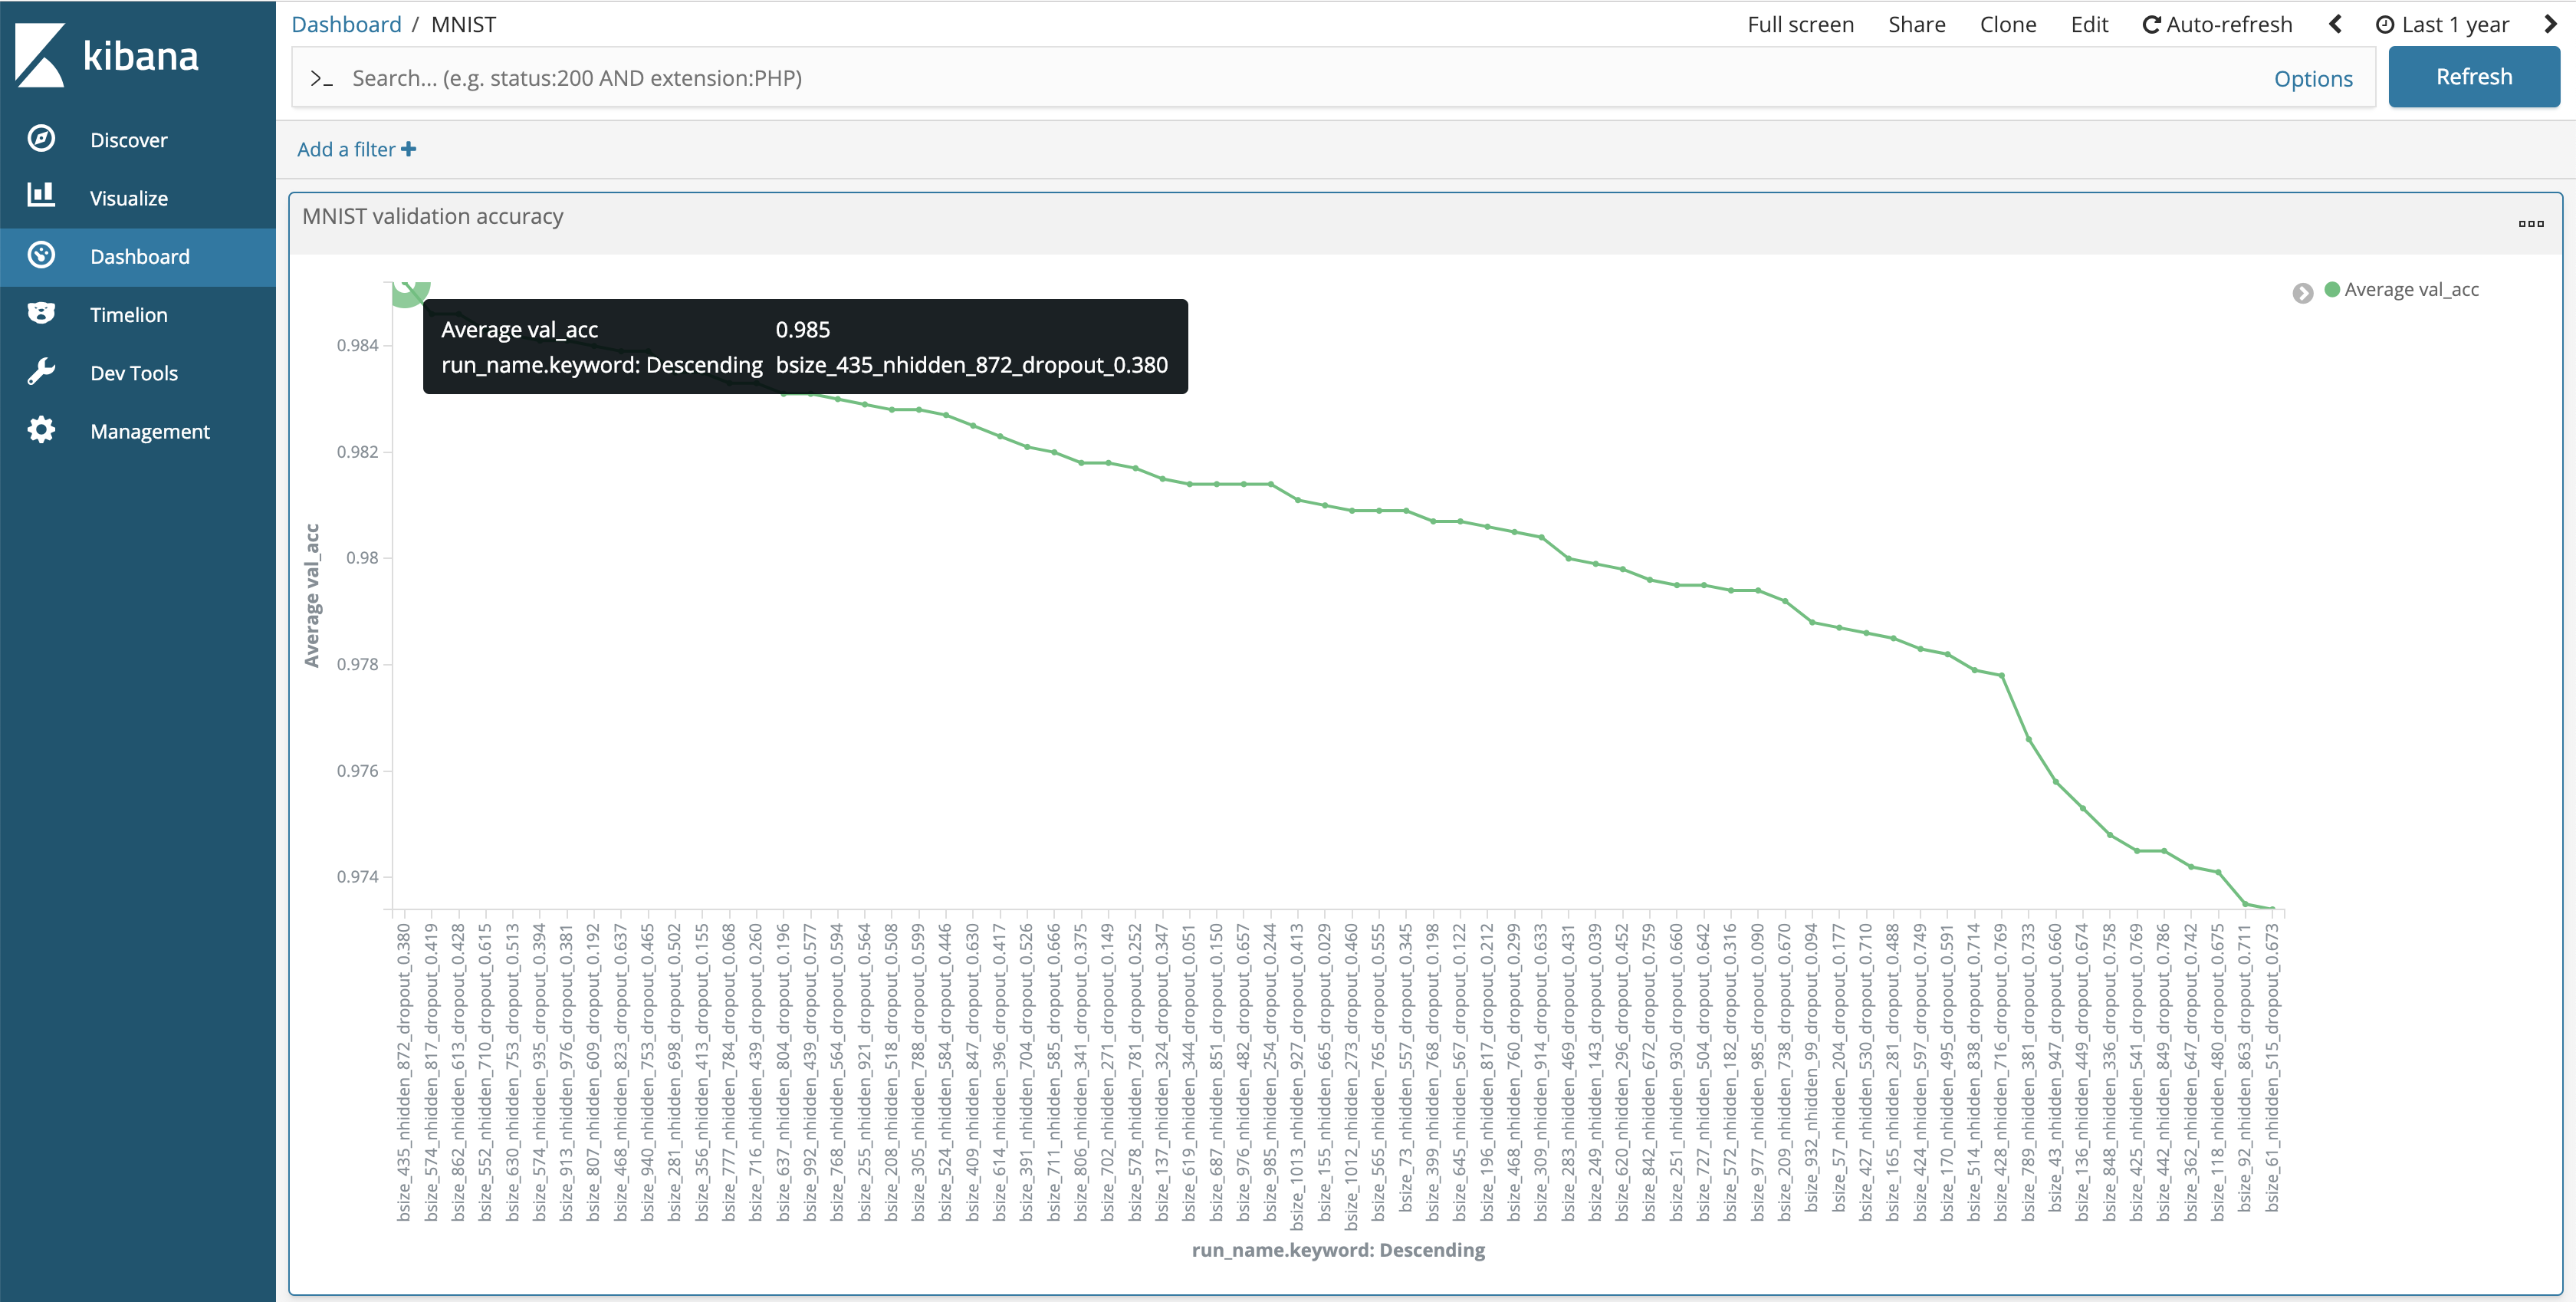 Fig. 6: Visualizing the validation accuracies from one hundred MNIST experiments in Kibana. The tooltip is showing the name and accuracy of the best run.
While it is certainly possible to track your metrics in a spreadsheet, I strongly recommend setting up a database if you’re running a project in a professional setting. Spreadsheet tracking encourages your ML engineers to manually input experiment results, which is not only highly time consuming, but also prone to errors. In a recent blog post, Erik Bernhardsson shows that companies with plenty of this kind of overhead are better off hiring cheap subpar engineers, and that removing the overhead is essential to getting good bang for your buck when hiring above average engineers. Manual input also scales horribly when you’re running a large number of experiments or when you want to store more fine-grained results, for example per-image F1-score for image segmentation. Instead, using a proper database makes it easy to keep track of several different types and levels of metrics, and to seamlessly query and combine them. For example, if you’ve stored both experiment average accuracy and per-image pixel-wise accuracy, you could easily query:
“From the best experiment so far, give me the 100 images from the validation dataset that have the lowest pixel-wise accuracy.”
For qualitative results, I recommend setting up an object storage in case your model has image outputs, while when working with time-series I’d recommend storing the model output in a database. In a later blog post I will go into detail about how you can set this up.
There are a bunch of ready-made tools that can help you with your tracking and visualization.
- Sacred, developed by IDSIA, comes with a lot of functionality for automatically logging not only your metrics, but also for your whole config. It now also has several frontends available and runs on top of a MongoDB database.
- Elasticsearch + Kibana: Easy to set up and use to build beautiful real time visualizations. This is what I’ve used in the figures above.
- If you think it’s a hassle to set these things up yourself, you can check out the platform that Peltarion is building, where these things come out-of-the-box. (DISCLAIMER: I used to work there.)
- While it’s always good to try to avoid the not invented here syndrome, you can put together your own tooling for metrics tracking. It doesn’t have to be very complicated or take a lot of time, and you get the most flexibility. I would probably only do this if I tried some already existing solution and found it lacking some crucial functionality.
Conclusion
In this post I’ve offered my thoughts on ML metrics tracking. The main takeaways are that we want to track metrics in a fully automated way, using tools that make it easy for us and others to follow the progress of our project. In addition to quantitative metrics, we should also track model outputs, hyperparameters and code, to enable qualitative reasoning and debugging.
Is there something your team is doing differently, is there something I missed, or do you have something that you disagree with? Let me know at @sjosund.
If you found this blog post helpful, please share it with friends and colleagues!